Tuesday, 30 December 2014

After Record 2014 What Does 2015 Political Betting Hold In Store?

Written by Graham Sharpe
What does 2015 political year hold in store?
8/1 TWO 2015 GENERAL ELECTIONS AS NIGEL FARAGE 3/1 TO STAND DOWN AS UKIP LEADER
 
2014 WAS the biggest ever year for political betting, say bookmakers William Hill, who took over £3m just on the outcome of the Scottish Referendum, and twice set new records for the biggest ever political bet - initially when one client staked £200,000 on the Referendum outcome - which was then smashed, as another customer from South West London gambled £900,000 that the Scots would vote 'No' - and collected £1,093,333.33 when they did!
'2014 smashed all political betting records, but with a wide open General Election, and the build-up to the US Presidential Election, 2015 is well placed to attract a significant betting turnover' said Hill's spokesman Graham Sharpe.
WILLIAM HILL have released a series of odds speculating on events which may occur during 2015 on the political scene, including two General Elections to take place during the year, UKIP leader Nigel Farage standing down from the role, and a current MP appearing on one of the major reality tv shows:
 
Two General Elections to take place during 2015...........................................8/1
The May General Election to result in no overall majority for any one Party...2/5
Nigel Farage to cease to be Ukip leader during 2015............ 3/1
David Cameron to cease to be Con leader during 2015......... 7/4
Ed Miliband as above,Lab leader.................................................................... EVS
Nick Clegg as above, Lib Dem leader ....................................................................6/4
Alan Hope (MRLP) as above, Loony Party leader................. ...................................3/1
BoE interest rate to rise during 2015 ............................................5/6
Boris Johnson still to be Mayor of London on Dec 31, 2015...... 1/8
George Osborne to be Chancellor on Dec 31, 2015 ...................4/5
Ed Balls as above............................................................................. 11/8
17 year olds to be able to vote in by-/General Elections by Dec 31, 2015 .............3/1
An official date for an in/out EU Referendum to be announced by Dec 31,2015 ....5/1
A current MP to take part in I'm A Celeb/Celeb Big Brother/Strictly, during 2015............ 2/1
UKIP to poll more votes than Lib Dems at May 2015 General Election...............................................4/11
Lib Dems to poll more votes than UKIP at May 2015 General Election...............................................2/1
Alex Salmond to become an MP by winning Gordon seat in May 2015...............................................1/8
Alex Salmond to become Govt Minister as result of May 2015 General Election..................................6/1
 
General Election 2015:..2/5 No overall majority; 7/2 Con-LD coalition; 4/1 Labour overall majority; 4/1 Labour minority government; 9/2 Cons overall majority; 9/2 Lab-LD coalition; 6/1 Coalition involving Ukip; 13/2 Coalition involving SNP; 7/1 Cons minority govt; 40/1 Coalition involving Greens; 50/1 Ukip overall majority; 500/1 LD Overall majority.
How many seats will SNP win at May '15 G Election?....33/1 0-5; 12/1 6-10; 6/1 11-15; 3/1 16-20; 7/1 21-25 ; 5/6 26 or more.
How many seats will Labour win in Scotland at May '15 GE?..40/1 0-5; 18/1 6-10; 7/1 11-15; 5/1 16-20; 11/4 21-25; 3/1 26-30; 7/2 31-35; 11/2 36-40; 9/1 41-45; 8/1 46 or more.

List of Members of Parliament since 1945

A fantastic find on my travels,  by mick745
 

I have been working hard in collating the names of all the Members of Parliament since 1945 and can reveal that there have been 3,118 of them.  I have put them all in a spreadsheet which can be viewed here:

drive.google.com/file/d/0Bwvp6xntW0KwUVdFaThMMDFBRkk/view?usp=sharing

Bold italics indicates that a MP left during the Parliament.  Highlighted yellow are MPs that won by-elections.  I have placed it here for your information.  There is obviously lots of work to be done, I wish to add dates or birth and death (it can then be tracked how many are living or dead from each parliament, oldest and youngest MPs etc.), and other information such as peerages.  I also intend to take the database back further, at least to 1900.

Meanwhile I have extracted some information already including a list of MPs leaving at  each dissolution:

drive.google.com/file/d/0Bwvp6xntW0KwMEhmblNYRTREOGM/view?usp=sharing

And a list of retreads during this period (there are 225 of them):

drive.google.com/file/d/0Bwvp6xntW0KwVkxsXzBKVUF4c3c/view?usp=sharing

If the links above don't open try these

List of MPS

docs.google.com/spreadsheets/d/1bkK5snG9zWu-TF2CTSlXga1V5xQGE5CcSs-9ynjr-Ik/edit#gid=699015985

Retreads

docs.google.com/spreadsheets/d/1u-wFm6qCYpkT_VOejafnR75ipDtRSwBoKN4q99WetBs/edit#gid=159856529

MPs leaving at dissolution

docs.google.com/spreadsheets/d/1ZloKKTnr1XMRxD0Qp82kQ1kyUwHHK4ZBv-uaUrqcFK4/edit#gid=1664846591


Mick also asks for All comments on improvements that could be made gratefully received.


Sunday, 28 December 2014

5 public opinion trends from 2014 from YOUGOV

 https://yougov.co.uk/refer/HdvYK1txkm0PfdJX43_Iow/  <<< Follow the link if you would like to join the YOUGOV panel and have your opinions heard

From the Scottish independence referendum to the European Parliament elections, it's been a big year for politics - here are five trends that stood out

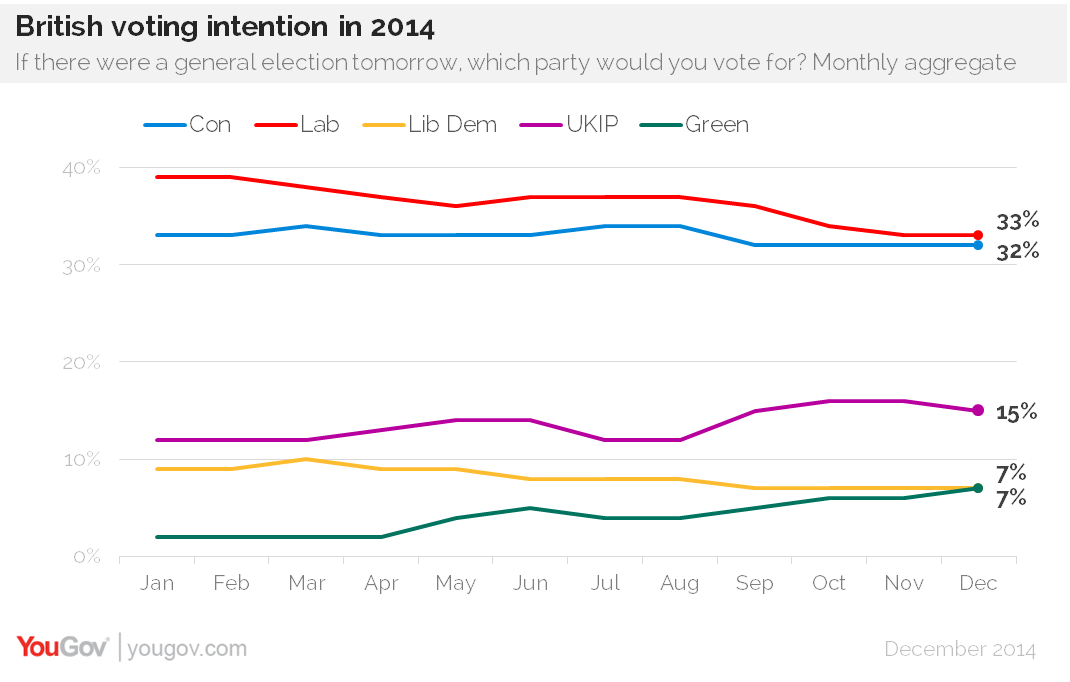
1. Labour and the Conservatives became almost tied in voting intention - and the Greens and Lib Dems actually did

In aggregate of YouGov's daily voting intention polls Labour started the year with a six point lead over the Conservatives, and ended it with a one point lead. Meanwhile, the Greens started as a party with only 1% more support than the BNP and finished as Britain's fourth most popular party - tied with the Lib Dems.

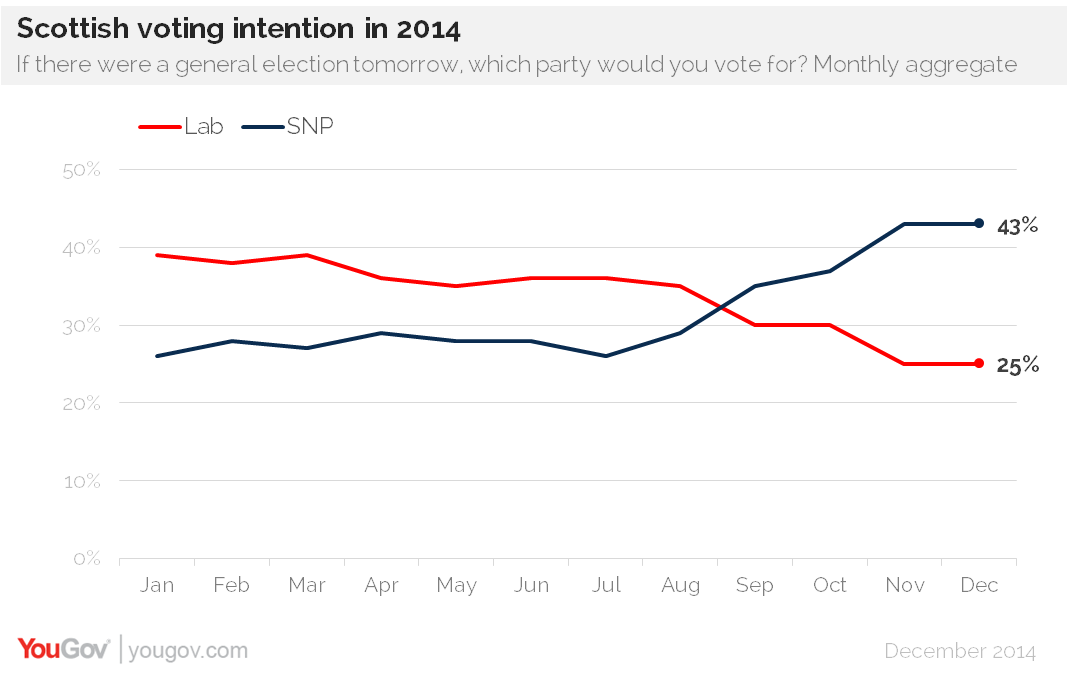
2. The Scottish National Party stole Labour's lead in Scotland

During September's Scottish independence referendum campaigning the SNP moved five points ahead of Labour in Scottish voting intention. Their lead continued to grow until November, when they were 18% clear of Labour, and sustained into December, when Jim Murphy was appointed as Scottish Labour's new leader.

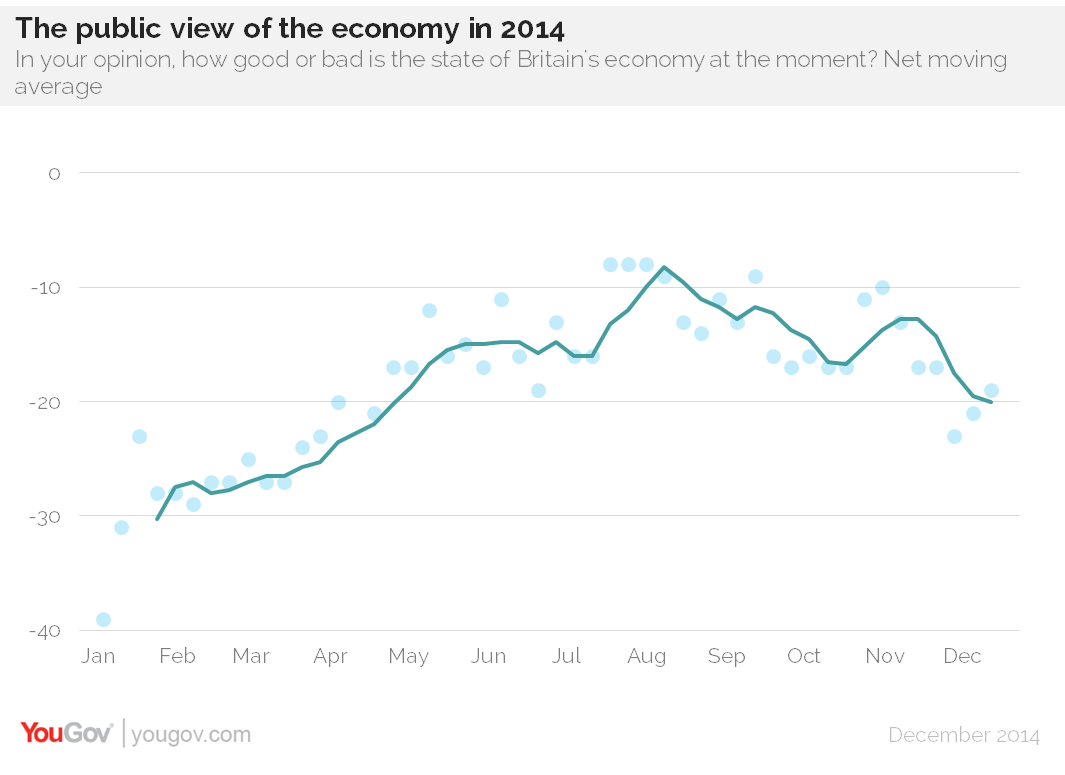
3. Perceptions of the economy peaked, and began to dip

In August perceptions of the economy were at their best since 2010, with 28% saying the economy was in a good condition and 36% saying it was bad (the worst rating to date was in December 2011, when 2% said the economy was performing well and 86% said it was doing badly). However since the summer perceptions have been on the wane, accompanying bad news on borrowing and downward revisions to growth figures.

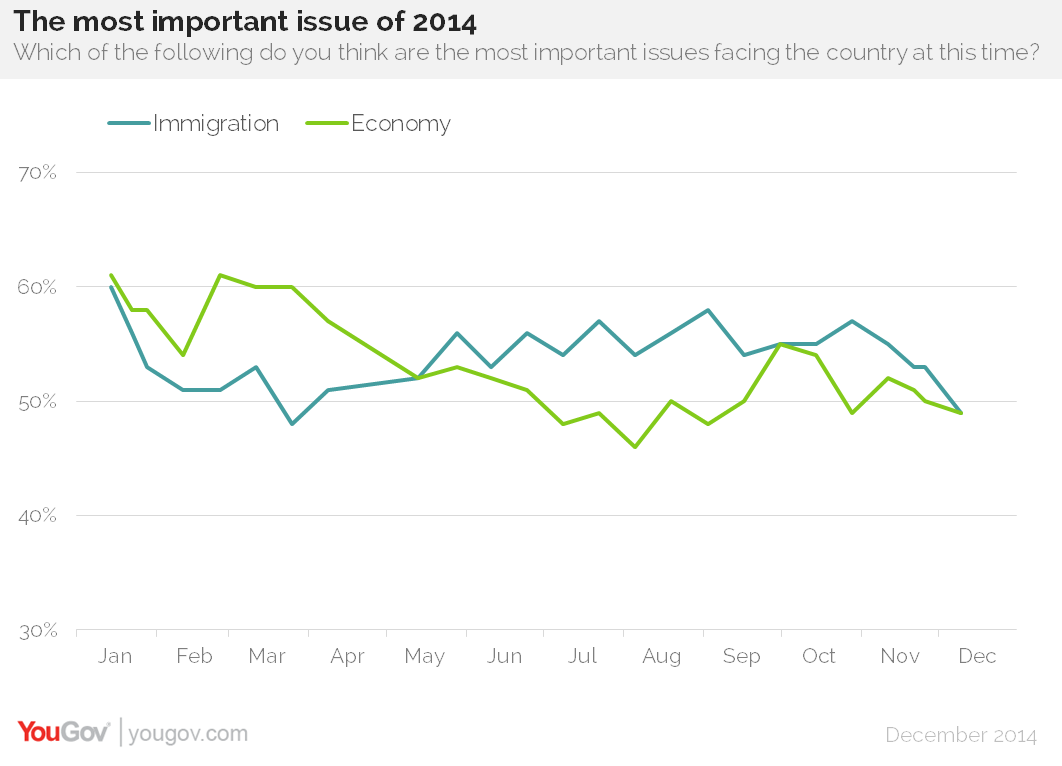
4. Immigration became the most important issue

From May to December immigration was seen as the most important issue facing the country, except for on three occasions when it was tied with the economy. Although immigration began to narrow the gap at the end of 2013, 2014 is the first year since 2010 when the economy has not been the top issue; immigration had an average lead of one point over the whole year, compared to a deficit of 18 in 2013 and 32 in 2012.

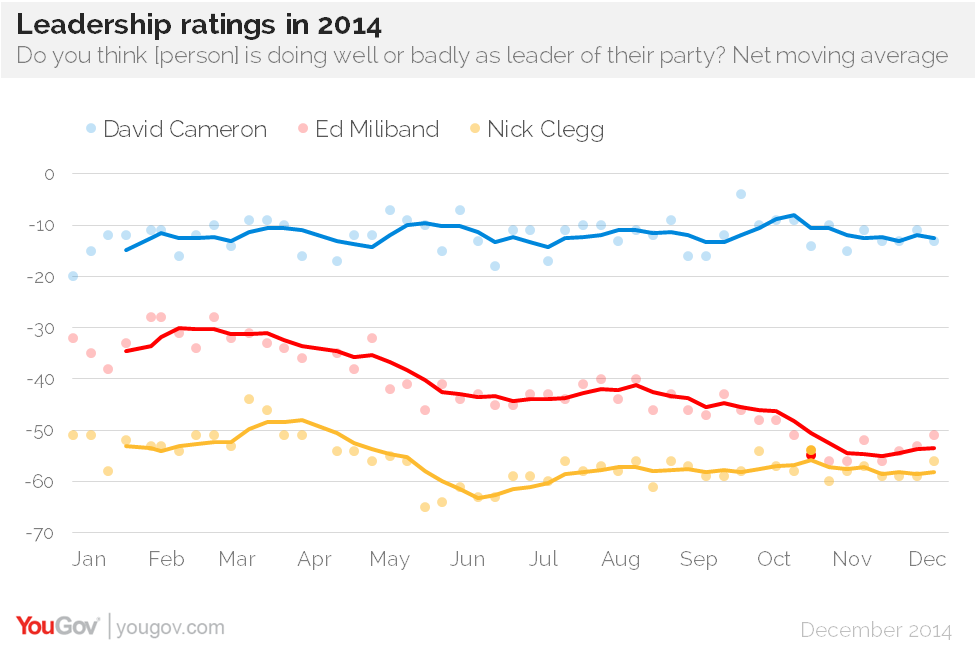
5. And Ed Miliband's leadership ratings reached a new low

At the end of October one poll registered Ed Miliband (-55) as less popular than Nick Clegg (-54). The Labour leader's December average was -53, down 18 points from his January average of -35. Ed Miliband's high point was in October 2012, when his average approval (-14) was better than David Cameron's (-20).

Originally posted here >>>  https://yougov.co.uk/news/2014/12/28/5-public-opinion-trends-2014/

Saturday, 27 December 2014

The difference between Female & Male first time voters (Opinium)


http://ourinsight.opinium.co.uk/sites/ourinsight.opinium.co.uk/files/op4966_first_time_voters_-_tables_-_ftv_-_final.pdf

Minister Salmond?

Written by Graham Sharpe
 
6/1 ALEX SALMOND MP TO BE GOVT MINISTER.....

As a poll  predicts a slump in Labour's support in Scotland, Alex Salmond is a 6/1 chance with William Hill to become a government minister after the General Election - which Hills offer 13/2 will result in a Labour-SNP coalition government.Mr Salmond is 1/8 favourite with Hills to win the Gordon seat at the General Election.

Hills make the SNP 5/6 to win 26 or more seats at the General Election - a number which might well result in Labour being unable to win an overall majority.

'Labour may well be forced to team up with the SNP in order to form a government' said Hill's spokesman Graham Sharpe, 'And the price to pay for their compliance would be likely to include a Ministerial role for Mr Salmond - who we quote at 20/1 to accept a Peerage at any stage.'

How many seats will SNP win at G Election?....33/1 0-5; 12/1 6-10; 6/1 11-15; 3/1 16-20; 7/1 21-25 ; 5/6 26 or more.

How many seats will Labour win in Scotland at GE?..40/1 0-5; 18/1 6-10; 7/1 11-15; 5/1 16-20; 11/4 21-25; 3/1 26-30; 7/2 31-35; 11/2 36-40; 9/1 41-45; 8/1 46 or more.

LINK >>>>>>>>>> LATEST SCOTTISH POLLING
WHICH SHOWS SNP GAINS OF 39 SEATS

New Scottish Westminster poll from ICM

SNP 43% (+23) Lab 26% (-16) Con 13% (-4) UKIP 7% (+6) Lib Dem 6% (-13) Green 4% (+3)


source http://www.theguardian.com/uk-news/2014/dec/26/labour-bloodbath-scotland-general-election-2015-snp-westminster

Friday, 26 December 2014

A list of upcoming and vacant council byelections/seats

There are 4 by-elections called so far for January 2015, including one for 2 seats, and 1 in February. A further 12 vacancies are known where the election has as yet no date, although up to 8 could remain unfilled as they are to be contested again in May. So far 13 vacancies have been identified as classified under the "six month" rule.

There were 22 by-elections ahead of the main elections in 2011, the same period in the local council election cycle as 2015, which may be a benchmark for the number expected this year.

22nd January - 1
Fife UA, Kirkaldy East - SNP resigned - 8 candidates: Con, Lab, LD, SNP, UKIP, Green, 2 x Ind
Wealden DC, Crowborough West - Conservative died - 2 candidates: Con, UKIP

28th January - 1
West Berkshire UA, Purley-on-Thames - Conservative died

29th January - 1 for 2 seats
St Albans DC, Marshalswick South- 2 Conservatives resigned

12th February - 1
Harlow BC, Mark Hall - UKIP resigned

Current known vacancies where by-election not yet called - 12
Derbyshire CC, Brimington - Labour died 22nd October
Cambridgeshire CC, Bar Hill - Conservative died around 22nd November
Camden LB, St Pancras & Somers Town - Labour died 18th December
Carmarthenshire UA, Hengoed - Labour died around 29th November
* Herefordshire UA, Mortimer - Conservative died 6th November
* High Peak DC, Limestone Peak - Conservative died around 15th September
* Lichfield DC, St John's - Conservative died 14th September
* Rushcliffe DC, Manvers - Conservative died 26th September
* South Oxfordshire DC, Goring- Conservative died 21st September
* South Ribble BC, Bamber Bridge West - Labour died 1st November
* St Edmunsbury BC, Haverhill East - Conservative sitting as UKIP died 2nd October
* Waveney DC, St Margaret's - Labour died 8th November

* seats that will be contested again in May 2015.
Whilst not covered by the "6 month" rule, experience from earlier years suggests some may be left unfilled until May particularly as a number are being re-warded in May.

Vacancies covered by the "6 month" rule - 13
Bedford UA, Great Barford - Conservative died 6th December
Bracknell Forest UA, Winkfield & Cranborne - Conservative died 18th November
Eastleigh BC, Hedge End Wildern - Liberal Democrat resigned 2nd December
Milton Keynes UA, Monkston - Liberal Democrat resigned 17th November
Perndle BC, Clover Hill - Labour resigned around 3rd December
Rotherham MB, Silverwood - Labour resigned around 26th November
Rushcliffe DC, Thoroton - Conservative died 16th November
Shepway DC, Hythe East - Conservative died 7th December
Stroud DC, Nailsworth - Conservative died close to rule becoming applicable
Torbay UA, Blatchcombe - Conservative died around 4th December
Waverley BC, Cranleigh East - Conservative died 29th November
Wealden DC, Buxsted & Maresfield - Conservative resigned 26th November
Wychavon DC, Badsey - Conservative died 15th November

Council by election round up for 2014

The Fantastic work of MiddleEnglander

The total number of by-elections during 2014 at 271  was slightly down on 2010, the same period in the electoral cycle, although vacancies then may have been boosted by councillors resigning their seats on becoming MPs in the General Election.  The number of seat changing hands is consistently  close to 30%.

The nomenclature has also been altered to reflect the annual May elections this year were a couple of weeks later than normal.
Where "double" elections were held in May, the candidate with the higher vote was assumed to have won the annual election and the runner up the by-electiion.
All figures exclude deferred and delayed elections including Exeter and Norwich in 2010.


    2014         2014         2013         2013         2012         2012         2011         2011         2010         2010     

  Number Changed  Number Changed  Number Changed  Number Changed  Number Changed
England only:


- January to annual        46     33%       47     28%       48     40%       22     32%       41     44%
- annual , single contests           30     20%     114     25%       23     13%       23     17%       38     26%
- annual, multi contests       40     28%

       29     17%       25     36%       45     22%
- other May to August       44     39%       56     43%       53     13%       30     37%       48     38%
- September & October       43     35%       53     23%       30     37%       36     17%       58     22%
- November & December         36     25%       40     33%       49     27%       26     31%       31     32%
England total     239     31%     310     29%     232     25%     162     28%     261     30%
Scotland       17     41%       14     43%         3   100%       18     44%         4     25%
Wales       15     27%       13       8%         8     63%       12     75%       16     38%
GB total     271     31%     337     29%     243     27%     192     32%     281     31%

The number of gains and losses by party during 2014 is given by:

Party    Gains
  Jan - May  
    Losses
  Jan - May   
     Gains
  May 22nd   
    Losses
  May 22nd   
    Gains
  Jun - Dec    
    Losses
  Jun - Dec   
  Total gains  
       2014
  Total losses  
        2014
Net gains / (losses)
           2014
Conservative         4         9         3         5       10       13          17           27            (10)
Labour         2         2         5         6         9         8          16           16                -
Liberal Democrats         5         1
         1         9         6          14             8                6
SNP

          1         3         2            3             3                -
Plaid Cymru


         1
            1
                1
UKIP         1
         5
         8         4          14             4              10
Green

         4         1         1         1            5             2                3
Resident Groups           1         1

         3         3            4             4                -
Independents            2         2         2         4         5       11            9           17               (8)
Social Democrat  


         1
             1               (1)
Independent Socialist


         1


             1               (1)
No Description         1         1


                      1             1                -
Total       16       16       19       19       49       49          84                   84                -

The Conservative and Independents were the main net losers during 2014 although on a relatively limited scale at least as far as the Conservatives are concerned being both the largest councillor base and also in Government.  UKIP and the Liberal Democrats were the biggest gainers, particularly UKIP from May onwards.  Labour's gains were offset by the losses to give a net nil.

There were 141 by-elections for 142 seats during the 7 months June to December 2014 with 49 (35%) changing hand or 47 (33%) excluding 2 Lincolnshire Independent (classed as a Resident Group) gains from Independent.   The results can be summarised by:

Party  Candidates      Defended       Retained        Gained           Lost             Won       retention rate
Conservatives          138         48        35       10       13        45       73%
Labour        125         47        39         9         8        48       83%
Liberal Democrats             83         14          8         9         6        17       57%
SNP            8           4          2         3         2          5       50%
Plaid Cymru               4           1          1         1
          2     100%
UKIP        113           6          2         8         4        10       33%
Green          63           2          1         1         1          2       50%
Resident Groups *             8           3
         3         3          3         0%
Independents **          59         16          5         5       11        10       31%
Social Democrat                       1

         1
         0%
No Description            4


BNP            2


Christian People's Alliance              1


English Democrats               3


Liberal            1


Mebyon Kernow            2


TUSAC          13


Others ***            5


Total        632       142        93       49       49      142       65%

*   Lincolnshire Independent, Canvey Island Independent, Derwentside Independent and Llandaff North Independent, Its Our County (Herefordshire), Community Action (Wigan) as well as Mansfield Independent Forum
** 59 Independents contested 43 seats
*** 1 each for British Democrats, Blue, Justice, OMRLP and Patriotic Socialist

The Conservatives contested all but 4 or 97% of the seats, Labour 88% and the Liberal Democrats 58% with UKIP contesting 80% and Greens 44%.

Although 49 seats changed hands during the seven months, just 15 were between Conservatives, Labour and Liberal Democrats
- Conservatives gained Cornwall: Mevagissey and Melton: Asfordby from Labour
   together with Broadland: Wroxham, Somerset: Frome North and Wokingham: Bulmershe from Liberal Democrats
- Labour gained Charnwood: Thurmaston and Crawley: Southgate from the Conservatives and Craven: Skipton West from the Liberal Democrats
- Liberal Democrats gained Cornwall: Illogan, Epping Forest: Hemnall, Guildford: Lovelace and Maidstone: Staplehurst from the Conservatives
   together with Aylesbury Vale: Southcourt, Cambridge: Queen Edith's and York: Westfield from Labour

Conservatives gained a total of 10 seats - 2 from Labour, 3 from Liberal Democrats, 2 fromUKIP, 2 from Independent and 1 from Green
- losing a total of 13 - 2 to Labour, 4 to Liberal Democrats, 3 to UKIP and 1 each to SNP, Independent, Green and Its Our County
They gained 3 County Council seats -  Essex: Brightlingsea (UKIP), Gloucestershire: Mitcheldean (Ind) and Somerset: Frome North (Lib Dem)
* along with 3 Unitary - Cornwall: Mabe, Perranarworthal & St Gluvias (UKIP), Cornwall: Megavissey (Lab) and and Wokingham: Bulmershe (Lib Dem)
* 4 District - Broadland: Wroxham (Lib Dem), East Cambridgeshire: Soham South (Ind), KingsLynn & West Norfolk: Airfield (Green) and Melton:Asfordby (Lab)
They lost 5 Unitary seats - Cornwall:Illogan (Lib Dem), Herefordshire: Ledbury (Its Our County), Herefordshire:  Leominster South (Green), Medway: Peninsula (UKIP) and Telford & Wrekin: Newport West (Ind)
* 7 District - Charnwood: Thurmaston (Lab), Crawley: Southgate (Lab), Epping Forest: Hemnall (Lib Dem), Guildford: Lovelace (Lib Dem), Maidstone: Staplehurst (Lib Dem), Shepway: Folkestone Harvey Central (UKIP) and Swale: Sheppey Central (UKIP)
* together with 1 in Scotland - Aberdeenshire: Troup (SNP)

Labour gained a total of 9 seats - 2 from Conservatives, 1 from Liberal Democrat, 2 from UKIP, 1 from SNP, 1 from Independent and 2 from Resident Groups
- losing a total of 8 - 2 to Conservatives, 3 Lto iberal Democrats and 1 each to UKIP, SNP and Independent
They gained 2 Unitary seats - Durham: Crook (Ind) and Durham: Burnopfield & Dipton (Derwentside Ind)
* 5 District - Charnwood: Thurmaston (Con), Craven: Skipton West (Lib Dem), Crawley: Southgate (Con), Mansfield, Netherfield (Mansfield Ind Forum) and Redditch: Church Hill (UKIP)
* together with 1 in Scotland and 1 in Wales - South Lanarkshire: Clydesdale South (SNP) and Merthyr Tydfil: Pennydarren (UKIP)
They lost 1 Metropolitan and 2 Unitary - Doncaster: Edenthorpe, Kirk Sandall & Barnby Dun (UKIP), Cornwall: Megavissey (Con) and York: Westfield (Lib Dem)
* 3 District - Aylesbury Vale: Southcourt (Lib Dem), Cambridge: St Edith's (Lib Dem) and Melton: Asfordby (Con)
* together with 1 in Scotland and 1 in Wales - Moray: Elgin City North (SNP) and Swansea: Uplands (Ind)

Liberal Democrats gained a total of 9 seats - 4 from Conservatives, 3 Labour and 2 Independents
- whilst losing a total of 6 - 3 to Conservatives and 1 each to Labour, UKIP and Independent
They gained 4 Unitary Seats - Cornwall: Illogan (Con), York: Westfield (Lab), Northumberland: Longhoughton (Ind) and Rutland: Whissendine (ind)
* 5 District - Aylesbury Vale: Southcourt (Lab), Cambridge: St Edith's (Lab), Epping Forest: Hemnall (Con), Guildford: Lovelace (Con) and Maidstone: Staplehurst (Con)
They lost 2 County Council seats and 1 Unitary - North Yorkshire: Skipton West (Ind), Somerset: Frome North (Con) and Wokingham: Bulmershe (Con)
* 3 District - Broadland: Wroxham (Con), Craven: Skipton West (Lab) and Worthing: Castle (UKIP)

UKIP gained a total of 8 seats - 3 from Conservatives, 2 from Independents and 1 each from Labour, Liberal Democrats and Social Democrat Party
- whilst losing a total of 4 seats - 2 to Conservatives and 2 to Labour
They gained 2 Metropolitan seats - Doncaster: Edenthorpe, Kirk Sandall & Barnby Dun (Lab) and South  Tyneside: Westoe (Ind)
* 1 County Council and 2 Unitary - Lincolnshire: Stamford North (Ind), East Yorkshire: Bridlington Central & Old Town (SDP) and Medway: Peninsula (Con)
* 3 District - Shepway: Folkestone Harvey Central (Con), Swale: Sheppey Central (Con) and Worthing: Castle (Lib Dem)
They lost 4 - Cornwall: Mabe, Perranarworthal & St Gluvias (Con), Essex: Brightlingsea (Con), Merhyr Tydfil: Pennydarren (Lab) and Redditch: Church Hill (Lab)

Independents gained 5 seats in total - 1 each from Conservative, Labour, Liberal Democrat, SNP and Canvey Island Independent
- whilst losing a total of 11 - 2 each to Conservative, Liberal Democrat, UKIP and Lincolnshire Independent as well as 1 each to Labour, Plaid Cymru and SNP
They gained 1 County Council and 1  Unitary - North Yorkshire: Skipton West (Lib Dem) and Telford & Wrekin: Newport West (Con)
* 1 District - Castle Point: Canvey East (Canvey Island Independent)
* together with 1 in Scotland and 1 in Wales  - Argyll & Bute: Oban North & Lorn (SNP) but subsequently lost in second by-election and Swansea: Uplands (Lab)
They lost 1 Metropolitan and 2 County Council - South Tyneside: Westoe (UKIP), Gloucestershire: Mitcheldean (Con) and Lincolnshire: Stamford North (UKIP)
* 3 Unitary - Durham: Crook (Lab), Northumberland: Longhoughton (Lib Dem) and Rutland: Whissenden (Lib Dem)
* 3 District - East Cambridgeshire: Soham South (Con), North Kesteven: Quarrington & Mareham (Lincs Ind) and North Kesteven: Westholme (Lincs Ind)
* together with 1 in Scotland and 1 in Wales - Argyll & Bute: Oban North & Lorn (SNP) in second by-election and Carmarthenshire: Trelech (Plaid Cymru)

Resident Groups gained Herefordshire: Ledbury (Its our County from Con), North Kesteven:  Quarrington & Mareham (Lincs Ind from Ind) and North Kesteven: Westholme (Lincs Ind from Ind)
- but lost Castle Point: Canvey East (Canvey Island Ind to Ind), Durham: Burnopfield & Dipton (Derwentside Ind to Lab) and Mansfield: Netherfield (Mansfield Ind Forum to Lab)

Greens gained Herefordshire: Leominster South (Con) but lost Kings Lynn & West Norfolk: Airfield (Con)
Social Democrat Party lost East Yorkshire: Bridlington Central & Old Town (UKIP)

SNP regained Argyll & Bute: Oban North & Lorn (Ind), gained Aberdeenshire: Troup (Con) and Moray: Elgin City North (Lab)
- but losing Argyll & Bute: Oban North and Lorn (Ind) in first by-election and South Lanarkshire: Clydesdale South (Lab)
whilst Plaid Cymru gained Carnarthenshire: Trelech (Ind)
Wednesday, 24 December 2014

YOUGOV (OFFENSIVE WORDS V VOTING)

https://yougov.co.uk/refer/HdvYK1txkm0PfdJX43_Iow/  <<< Follow the link if you would like to join the YOUGOV panel and have your opinions heard

Talking about a UKIP candidate who had been
recorded using the words "chinky" and "poofter"
Nigel Farage said that the candidate "was a council
house boy" who "talks and speaks in a way a lot of
people from that background do" 
http://d25d2506sfb94s.cloudfront.net/cumulus_uploads/document/tom73ueyir/Sun_Results_141222_Offensive_Words_Website.pdf 

Final Westminster Voting Intention Poll of the Year. from SURVATION

Happy Christmas from Survation. Here is our final voting intention poll of 2014 - Survation for tomorrow's Daily Mirror.

Survation interviewed 1009 GB adults online between 18-19 December about their voting intention for next May's general election.

Results (with change since last Survation/Daily Mirror poll on 3 November):

LAB 33% (+2)
CON 30% (+3)
UKIP 21% (-3)
LD 10% (+1)
OTHERS 6% (-3)

Damian Lyons Lowe, Chief Executive of Survation said:

"To the casual observer, these figures might suggest a close race for the 2015 General Election between the Conservatives and the Labour party. However, the Conservative party need to be ahead of Labour by a considerable margin to even begin to win seats needed to gain an overall majority.  Today we looked back at our polling for the Daily Mirror and found that in September 2012 - over 2 years ago - the Conservative party were on exactly the same vote share as today - 30%. In short, the Conservatives, with just 5 months left of this current, fixed-term parliament are yet to make make the progress needed to form a majority government"

Full tables for this poll are available here.

Tuesday, 23 December 2014

YOUGOV (Ever decreasing LibDems)

https://yougov.co.uk/refer/HdvYK1txkm0PfdJX43_Iow/  <<< Follow the link if you would like to join the YOUGOV panel and have your opinions heard

Calculation for this, take 10,000 minus the don't knows and won't votes then the percentage from the Yougov column who say they will vote for that party under the 2010 tab.
http://cdn.yougov.com/cumulus_uploads/document/3de0qwa0dn/YG-Archive-Pol-Sun-results-221214.pdf 

Monday, 22 December 2014

Eight things we learned from Lord Ashcrofts research in 2014

By

My research in 2014 has included a weekly national telephone poll, surveys in over 100 marginal seats, two rounds of my Project Blueprint research on the quest for a Conservative majority, a detailed study of voters’ attitudes to Europe, polling-day surveys of voters in the European elections, five by-election polls, and regular updates on the state of the parties. Here are some of the things we have learned:
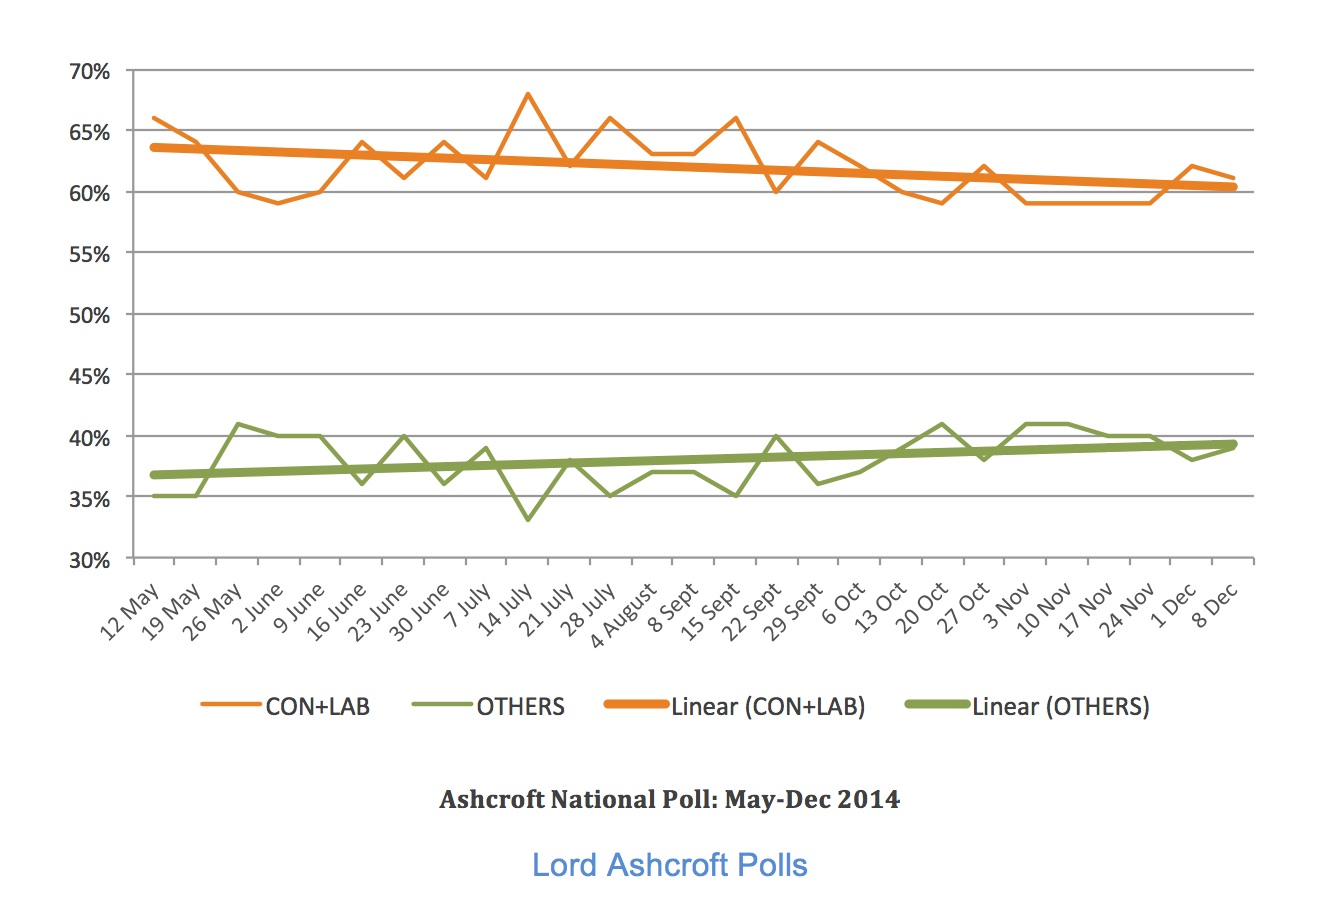
1. The two main parties are on the slide
At the 2010 general election, Labour and the Conservatives between them won 67% of the vote in Great Britain. In six of the last nine weekly editions of the Ashcroft National Poll they have scored a combined total of 60% or below, and on five occasions since mid-October have managed just 59%. The trend over the course of the ANP is slight, but with five months until polling day is unmistakeably away from the two largest parties.
ConLab v Others


2. With no uniform swing, national polls are not the best guide to seat numbers
Falling support for the two largest parties, combined with the decline of the Liberal Democrats, makes it harder to predict the number of seats each party will have on the basis of their national vote shares. This is doubly the case given the lack of a uniform swing. Taken together, groups of Conservative-Labour marginals in my research have shown swings to Labour at a similar level to those in the national polls, but there are wide variations between seats with similar majorities: in the first round, published in May, I found swings to Labour of 8% in Amber Valley and just 2% in Morecambe & Lunesdale. The variations are even more marked where the Lib Dems are defending seats from the Tories: in September I found a 10% swing from the Lib Dems to the Conservatives in Chippenham and a 7% swing from the Tories to the Lib Dems in Sutton & Cheam. UKIP’s heavily concentrated local campaigning also make uniform swing calculations less useful.
All this makes it harder than usual to predict the outcome. In November I found around a quarter of voters expecting a Labour government, another quarter expecting a Conservative government, one eight expecting a Labour-Lib Dem coalition and another eight expecting a Conservative-Lib Dem coalition. Most of the rest said they didn’t know what to expect. (I think I’m with them.)
3. UKIP are still hurting the Tories most – but Labour are not immune
My research in the marginals has consistently found 2010 Conservative voters more likely than 2010 Labour voters to say they are switching to UKIP (16% compared to 8% in my latest round of Con-Lab marginals, released last week). But UKIP pose a threat to Labour in some seats – in Great Grimsby, Plymouth Moor View and Rother Valley I found UKIP ahead of Labour on the standard voting intention question; only when voters were asked to think about how they would vote in their own constituency did Labour claw back a small lead.
Incidentally, information like this from individual constituency polls has the potential to drive localised tactical voting, as people can see who is in the best position to challenge the incumbent in seats that one party has dominated for decades.
4. Trying to win back UKIP voters will be costly if done wrong
Most voters, including a majority of Conservatives, would be unhappy to see UKIP as part of a coalition government. Indeed Tories would rather see the Lib Dems or the Greens as part of a coalition than Nigel Farage’s party. Tory voters give higher (or rather, less low) ratings to Nick Clegg and the Lib Dems than to Farage and UKIP. My marginals polling has consistently shown around three quarters of Conservatives saying they would definitely not vote UKIP. This illustrates that trying to win back defectors by trying to be more like UKIP would not only fail on its own terms but would risk alienating some existing Tory supporters – not to mention putting off potential joiners from the Lib Dems.
But as I found in my research on Europe, the message “vote UKIP, get Labour” can only have limited success. Most voters either disagreed that a vote for UKIP made a Labour government more likely, or didn’t know whether it was true or not. Some voters may also hear a patronising message to the effect that they are too dim to understand the consequences of their vote – and many live in seats where UKIP present the only prospect of removing a sitting Labour MP.
Ultimately, the biggest motivation of UKIP voters is that the established parties have little to offer and that there is nothing to choose between them. Those who are willing to return will need to feel that it matters who wins in 2015.
5. Talking more about Europe and immigration undermines the Tory advantage on leadership and the economy
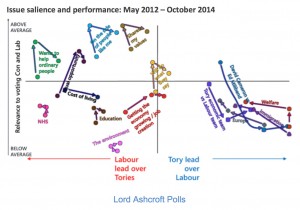
The strong preference for David Cameron as Prime Minister, and the greater trust in the Conservatives on managing the economy, are the two biggest advantages the Tories have over Labour. However, even as those leads have grown over the last two years, they have come to matter less in people’s choice between the two main parties. The effect is shown in this chart, which tracks the importance of different issues and the two parties’ relative performance on them.
Salience chart 141207


At the same time, immigration and Europe have grown in salience (partly, no doubt, because the Conservatives spend so much time talking about them) but the Tories’ lead on those issues has dropped (partly, no doubt, because they seem unable to do very much about them). Talking more about them without being able to act can only raise frustration with the main parties, highlighting the appeal of UKIP, and detracting from the Tories’ real strengths.
6. Voters must know the purpose of austerity (and what’s in it for them)
Relatively few voters (16% in October) say they already feel the benefits of an economic recovery. The big divide is between those who expect to at some point (43%) and those who do not (41%). (UKIP voters are the most likely of all to think any recovery will pass them by). There is a similar divide between those who accept the need for continued austerity and spending cuts (45%) and those who think either that no further cuts are needed (35%) or that they were never necessary in the first place (20%). Not surprisingly, those who expect some benefit from the recovery and understand why austerity is not over – who have some idea of what they government is trying to do and how it will help them, both in terms of their own prosperity and the services they use – are more likely to be part of the “coalition of the willing” who will vote Conservative next May or consider doing so.
7. An MP’s incumbency advantage is earned, not bestowed
Studies in recent elections have shown that MPs seeking re-election for the first time tend to do better than their party as a whole. Some now speak of this “first time incumbency” advantage as though it is automatic, and will disproportionately help the Tories, who have the most new MPs. But no such consistent pattern has emerged in my constituency polling. Some MPs are doing better than the national or regional trend (especially Lib Dems) and some are not. No MP can expect a boost simply because he or she has only served one term.
8. There is plenty of room for movement before election day
In the Ashcroft National Poll I regularly find only just of half of people saying they have definitely decided how they will vote. My marginals research shows that Tory defectors to UKIP overwhelmingly prefer Cameron to Miliband and that a Conservative government is their preferred election outcome. Only around half of them rule out returning to their old party before the election, as do only six in ten Lib Dem defectors to Labour. My Rochester & Strood poll found more than one fifth of UKIP voters saying either that they would revert to the Tories in a general election, or that they didn’t know what they would do. Six in ten swing voters, and a third of those who currently say they will vote Labour, worry that Labour have not learned the right lessons from their time in government and that they might spend and borrow more than the country can afford.
In other words, much could change before next May – which is why a poll is (all together now) a snapshot not a prediction.

SURVATION - Jim Murphy faces huge uphill task to return Labour Party to power in Scotland

LAST NIGHTS MAIL FROM

Survation Ltd
For Immediate Release

Survation/Daily Record poll shows Jim Murphy faces huge uphill task to return Labour Party to power in Scotland:

Daily Record Article here:

Headline Figures

Scotland Westminster 2015:
CON 16% LAB 24% LD 5% SNP 48% UKIP 4% Others 2%

Holyrood Constituency:
CON 15% LAB 25% SNP 51% LD 5% UKIP 2% GRE 2% AP 1%

Holyrood List:
LAB 24% CON 14% SNP 40% LD 6% GRE 9% UKIP 7% AP 1%  => The Scottish Green Party and UKIP would secure Holyrood representation

This is the 9th poll in the Survation/Daily Record polling series-  the most consistent and most accurate during the Scottish Independence referendum.

Full tables for voting intention including the full questions put are available here

Sunday, 21 December 2014

Yougov (HIPSTER v VOTING)

https://yougov.co.uk/refer/HdvYK1txkm0PfdJX43_Iow/  <<< Follow the link if you would like to join the YOUGOV panel and have your opinions heard


A hipster can be defined as 'a person who follows the latest
trends and fashions, especially those regarded as being outside
the cultural mainstream'. Thinking about this, how much do you
like or dislike hipsters?
http://d25d2506sfb94s.cloudfront.net/cumulus_uploads/document/lq11vmhmca/Internal_London_Hipsters_141218_Website.pdf 

IAIN DALES #GE2015 PREDICTION

As Iain Dale puts together his prediction we will be collating the results here. with 635 seats covered so far here is the current state of play.

CON 279 (-27) LAB 287 (+47) LD 23 (-34) SNP 18 (+12) UKIP 5 (+3) PC 3 (-) RESPECT 1 (-) SPEAKER 1 GREENS 0 (-1) NI 18

Each link sets out Iains' prediction.

MERSEYSIDE
LAB 13 (-) CON 2 (+1) LD 0 (-1)

CHESHIRE
CON 5 (-3) LAB 6 (+3)

GREATER MANCHESTER
LAB 23 (+1) CON 3 (+1) UKIP 1 (+1) LD 0 (-3)

WEST MIDLANDS 
LAB 13 (+2) CON 6 (-1) LD 0 (-1)

BIRMINGHAM
LAB 9 (+1) LD 0 (-1)

Scotland - Glasgow & Surrounds 
LAB 19 (-) SNP 1 (+1) LD 0 (-1)

Scotland - Borders & Ayrshire 
CON 2 (+1) LAB 4 (-1) SNP 1 (+1) LD 0 (-1)

Scotland - Edinburgh & Fife 
LAB 9 (-4) SNP 5 (+5) LD 1 (-1)

Scotland Central 
SNP 5 (+3) LAB 0 (-2) LD 0 (-1)

Scotland - North East / North & Islands 
SNP 6 (+2) LD 4 (-2) LAB 1 (-1) CON 1 (+1)

CUMBRIA 
CON 1 (-1) LAB 4 (+1) LD 1 (-)


COUNTY DURHAM 
LAB 7 (-)

LANCASHIRE
LAB 9 (+3) CON 7 (-2) LD 0 (-1)

NORTHUMBERLAND 
CON 2 (+1) LAB 2 (-) LD 0 (-1)

YORKSHIRE & HUMBERSIDE 
LAB 35 (+4) CON 18 (-3) LD 2 (-1) RESPECT 1 (-)

LINCOLNSHIRE
CON 5 (-2) LAB 1 (+1) UKIP 1 (+1)

NOTTINGHAMSHIRE 
CON 2 (-2) LAB 9 (+2)

WARWICKSHIRE
CON 4 (-2) LAB 2 (+2)

SHROPSHIRE 
CON 4 (-) LAB 1 (-)

HEREFORDSHIRE & WORCESTERSHIRE 
CON 8 (-)

OXFORDSHIRE 
CON 5 (-) LAB 1 (-)

WALES
LAB 28 (+2) CON 7 (-1) PC 3 (-) LD 2 (-1)

LONDON SOUTH 
CON 3 (-) LAB 6 (+1) LD 0 (-1)

LONDON SOUTH EAST
CON 5 (-) LAB 6 (-) LD 1 (-)

LONDON SOUTH WEST
CON 5 (+1) LAB 1 (-) LD 2 (-1)

LONDON CENTRAL 
CON 2 (-) LAB 4 (-)

LONDON WEST
CON 2 (-2) LAB 7 (+2)

LONDON NORTH WEST 
CON 3 (-2) LAB 7 (+4) LD 0 (-2)

LONDON NORTH EAST 
CON 3 (-1) LAB 8 (+1)

LONDON EAST
CON 2 LAB 6 NO CHANGE

NORTHAMPTONSHIRE
CON 5 (-1) LAB 2 (+1)

DERBYSHIRE 
CON 4 (-2) LAB 7 (+2)

STAFFORDSHIRE
CON 7 (-1) LAB 5 (+1)

LEICESTERSHIRE 
CON 6 (-1) LAB 4 (+1)

AVON 
CON 5 (-1) LAB 3 (+1) LD 3 (-)

SOMERSET
CON 4 (+3) LD 1 (-3)

DEVON 
CON 7 (-1) LAB 3 (+1) LD 2 (-)

CORNWALL
CON 6 (+3) LD 0 (-3)

SURREY
CON 11 (-)

GLOUCESTERSHIRE
CON 3 (-2) LAB 2 (+2) LD 1 (-)

DORSET 
CON 8 LD 0 (-1)

WILTSHIRE
CON 6 (-) LAB 1 (+1) LD 0 (-1)

HAMPSHIRE
CON 17 (+2) LAB 2 (-) LD 0 (-2)

BUCKINGHAMSHIRE 
CON 5 (-1) LAB 1 (+1) SPEAKER 1

WEST SUSSEX 
CON 8 (-)

EAST SUSSEX 
CON 3 (-2) LAB 4 (+4) LD 1 (-1) GREENS 0 (-1)

KENT
CON 16 (-) UKIP 1(-) No Change but Reckless to lose Rochester & Strood, Farage to win South Thanet

BERKSHIRE
CON 7 (-) LAB 1 (-) 

BEDFORDSHIRE 
CON 3 (-1) LAB 3 (+1) 

HERTFORDSHIRE 
CON 9 (-2) LAB 2 (+2) 

CAMBRIDGESHIRE 
CON 6 (-) LAB 1 (+1) LD 0 (-1) 

SUFFOLK
CON 4 (-2) LAB 2 (+2) 

NORFOLK
CON 6 (-1) LAB 2 (+2) LD 1 (-1) 

ESSEX
CON 14 (-2) UKIP 2 (+1) LAB 1 (+1) LD 1 (-)

NORTHERN IRELAND 
NO PREDICTIONS MADE ALL HOLDS

All of the original posts can be found here http://www.iaindale.com/

#GE2015 Forecast (DEC 21st)

most recently on 21 December 2014 at 13:40. To read commentary on the election using these forecasts, follow Election4castUK on Twitter. If you would like to give us feedback on this forecast, please email us at

 
When reading our seat predictions, please keep in mind that our model may not know as much about your specific seat of interest as you do. The model knows how the general patterns of support across the UK have changed in constituencies with different kinds of political, geographic and demographic characteristics. The model uses the Ashcroft constituency polls where available, plus smaller samples of polling data for every constituency, extracted from pooling many national-level polls. However, the model does not know whether your MP is beloved by constituents or embroiled in scandal, nor does it know whether Boris Johnson or Nigel Farage is standing in your constituency, let alone what the implications of that might be. Some of this might be picked up in the polls, but not all of it will be, and we do not have much polling data to go on when it comes to constituencies. In the aggregate, these aspects of constituency-specific competition tend to average out across parties, but they certainly matter in individual constituencies. Think of our seat-level projections as a baseline for what you might expect from past election results, geography and demography, plus a little bit of polling data.
Sortable table of predicted vote share for every party in every seat.
Sortable table of predicted probability of victory for every party in every seat.
The following tables focuses on potential seat gains and losses for each of the parties, including only those seats for which the probability of a change of control is estimated at over 10%. If the table is blank, there are currently no such seats.
Conservatives: Gains Losses
Labour: Gains Losses
Liberal Democrats: Gains Losses
SNP: Gains Losses
Plaid Cymru: Gains Losses
Greens: Gains Losses
UKIP: Gains Losses
The following table provides the individual seat predictions, aggregated up to England, Scotland and Wales. Please note that these may not exactly match the totals in the main forecast table, as they are based on the individual seat forecasts..
  Con Lab LD SNP PC GRN UKIP Oth
England 274 233 22 0 0 1 2 1
Scotland 0 18 1 40 0 0 0 0
Wales 7 30 2 0 1 0 0 0
The following table provides the individual seat predictions (columns), aggregated by the party that won the seat at the 2010 general election (rows). Please note that these may not exactly match the totals in the main forecast table, as they are based on the individual seat forecasts..
  Con Lab LD SNP PC GRN UKIP Oth
2010 Con 269 34 0 1 0 0 2 0
2010 Lab 0 235 0 23 0 0 0 0
2010 LD 12 10 25 10 0 0 0 0
2010 SNP 0 0 0 6 0 0 0 0
2010 PC 0 2 0 0 1 0 0 0
2010 GRN 0 0 0 0 0 1 0 0
2010 UKIP 0 0 0 0 0 0 0 0
2010 Oth 0 0 0 0 0 0 0 1
Party Lo Seats Hi Swing
Labour 244 286 332 28
Conservatives 232 278 319 -28
SNP 24 35 46 29
Liberal Democrats 17 26 36 -31
DUP 6 8 10 0
UKIP 1 3 7 3
SDLP 1 3 3 0
Plaid Cymru 1 2 4 -1
Greens 1 1 2 0
Other 7 8 10 0
Seat-by-seat predictions based on the party predicted to be most likely to win each seat.