Saturday 31 January 2015

#GE2015 Forecast from Elections ETC

The polls – and our forecast – are very little changed since last week. Labour still have just a one-point lead in our polling average, leading our model to give the Conservatives a 70% chance of winning the most votes come election day. However, our forecast remains much more finely-balanced when it comes to who’ll win the most seats: it’s pretty much a tossup, with the Tories the very, very slight favourites on 51% to Labour’s 49%. The chances of a hung parliament are again up slightly, to 84%, but the parliamentary arithmetic is more likely to favour Labour than the Tories. Our model suggests an 80% chance that there’d be enough MPs available for Ed Miliband to cobble together a majority (at least for a confidence motion) – although in the vast majority of those cases he’d need the support of the Lib Dems, the SNP, or both. This week we passed the ‘100 days to go’ mark, so it’s perhaps a good time to reflect on the general approach of our forecasting model for the share of the vote. The analysis of historical polls and votes still suggests government recovery and opposition setback from 100 days out, on average. But there is a lot of noise around the average.


The graphs below looks at the average of the polls between 85 and 115 days out in each election cycle since 1950 and how these compared with the eventual outcome for both the governing and principal opposition parties.
PTS_Gov100dayRecovery
PTS_Opp100daySetback
The opposition setback effect has been reasonably consistent since 1970, but the government recovery from this point in the cycle has not been so reliable in more recent elections. A large part of the average government recovery from c.100 days out is driven by the elections in the 1950s.
This wasn’t always the case. Equivalent graphs (eg. for 8 months out) show much more consistent government recoveries. It just happens that, over the last year or so, the Conservatives haven’t made the recovery history suggests they ought to have.
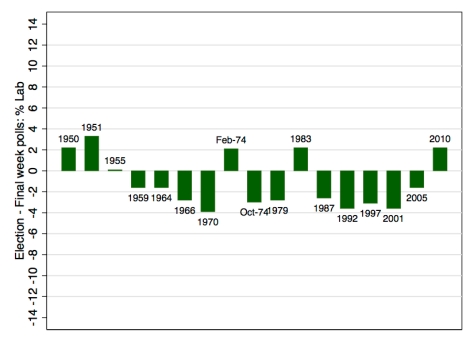
The Tories might take some comfort from the 1987 and 1992 recoveries from 100 days out in the first graph. But the further graphs below, comparing election results to final week polls, shows that in 1992 the polling industry bias or late swing to the Tories was even greater than the measured recovery from 100 days out. In fact, the Tories actually went down in the polls over the last 100 days in 1992, but were saved by the discrepancy between the final polls and the actual election outcome.
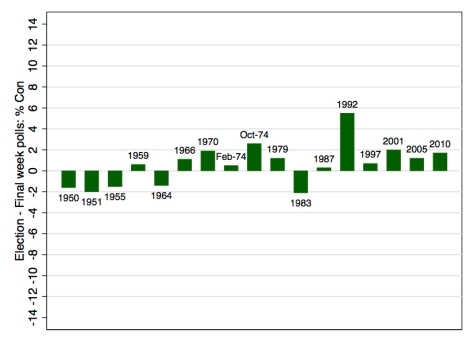
PTS_ConFinalWeekPollError
PTS_LabFinalWeekPollError
The graphs for election results relative to final week polls – plus the experience of polls for the European Parliament elections last year – suggest that the polls may be generous to Labour and underestimating the Tories again this year. But it would be unwise to rely on it.

Date of forecast: 30 January 2015
Days till the election: 97
Inputted current average poll shares
Con: 32%
Lab: 33%
LD: 8%
UKIP: 15%
Others: 12%
Forecast GB Vote Shares (with 95% Prediction Intervals)
Con: 33.9% (±5, i.e. 29% – 38%)
Lab: 31.3% (±5, i.e. 27% – 36%)
LD: 10.4% (±5, i.e. 6% – 15%)
UKIP: 13.6% (±5, i.e. 9% – 18%)
Others: 10.8% (±2, i.e. 9% – 13%)
Forecast Scotland Vote Shares (with 95% Prediction Intervals)
SNP: 43% (±5, i.e. 38% – 48%)
Labour: 30% (±5, i.e. 25% – 35%)
Forecast GB Seats (with 95% Prediction Intervals)
Con: 282 (234 – 336)
Lab: 280 (228 – 325)
LD: 24 (13 – 38)
SNP: 40 (26 – 50)
PC: 3
UKIP: 3
Grn: 1
(May not sum to 632 due to rounding of sums of probabilities. Prediction intervals not yet available for UKIP, PC and Grn.)
Central forecast: Con largest party, but short of a majority by 41
(Criterion for majority now changed to 323 not 326, assuming Sinn Fein win 5 seats and do not take them.)
Probabilities of key outcomes
Con largest: 51%
Lab largest: 49%
Hung Parliament: 84%
… with Con largest: 41%
… with Lab largest: 43%
Probabilities of predicted government outcomes:
(See here for explanations and assumptions)
Con majority: 10%
Con+NDown: 1%
Con+ND+DUP: 6%
Con+ND+LD: 9%
… with Con+ND+DUP also possible: 6%
… without Con+ND+DUP also possible: 3%
Con+ND+DUP+UKIP: 0%
Lab majority: 6%
Left (Lab+SDLP+PC+Grn): 4%
Left+LD: 26%
… with LD as kingmakers: 1%
… without LD as kingmakers: 25%
Left+SNP: 44%
… with Left+LD also possible: 25%
… without Left+LD possible: 19%
Left+SNP+LD: 25%
… with LD as kingmakers: 24%
… without LD as kingmakers: 1%
LD kingmakers: 24.5%
With a choice between Con+ND+DUP(+UKIP)+LD or
…Lab+SDLP+PC+Grn+LD: 0.5%
…Lab+SDLP+PC+Grn+SNP+LD: 24%
(Probabilities may not sum due to rounding)

Friday 30 January 2015

COMRES POLLWATCH: TOO CLOSE TO CALL


POLLWATCH:

TOO CLOSE TO CALL
This week we passed the “100 days” Election milestone. While it may be nothing more than a psychological benchmark, it is a significant moment in the election race. As the Conservatives took the lead in ComRes’s poll for the Independent, a deeper dig reveals an electorate divided on their preferred outcome.
You will have heard this described as “the most unpredictable” General Election in living memory, and just one of the factors in making it so difficult to call is Scotland. Since the independence referendum in September 2014, not only have SNP made significant gains but debate has centred on more powers being devolved to Scotland. In this Pollwatch we look at the views of MSPs in an exclusive ComRes poll.

STATE OF THE POLLS
For the first time since 2011 the Conservatives are back in the lead in ComRes’s monthly telephone poll series for The Independent. While that lead is only one point at the moment, the trend is unmistakeable. Ever since Labour’s high-water mark in mid-late 2012, their lead over the Tories has been steadily declining to the point where it has now all but entirely evaporated and the two are neck and neck. An average of all polls taken in January so far puts Labour ahead by just one point, while the two parties are tied on 32% if you average all 5 polls published in this week alone. In contrast, Labour enjoyed average leads of 3% in 2014, 5% in 2013 and 8% in 2012.
This race is too close to call, and adding further to the intrigue is the prospect that even if the ComRes poll with a one point Conservative lead were reflected at the General Election on May 7th, we would still see Labour as the largest party in the House of Commons.
That January poll average sees the Liberal Democrats on 8%, UKIP on 15% and the Greens on 7%. While the battle over the right to take part in the debates has clearly helped the Green cause – at least in the short term – it will be tougher for them to cope with the increased scrutiny that comes with the increased exposure.

HEAD OR HEART?
Despite the polls pointing towards a hung parliament being the most likely outcome in May (which would be only the second successive hung parliament in 183 years), it seems that experience of Coalition has done nothing to endear the concept to voters. In figures which echo the widespread scepticism before 2010’s inconclusive election result, three quarters of people (72%) would prefer one party with a majority over another coalition. Yet the 28% who would prefer a coalition of two or more parties are more likely to get their wish.
Voters do however disagree over who should run the country. While a majority would rather have David Cameron behind the black door of Number 10, voters are split down the line between the Conservatives and Labour on which party they want filling the government front benches within Parliament.
This difference in perception between leader and party is yet another reason behind the cigarette-paper gap in the polls between the top two parties. Ordinarily, you’d expect the Opposition to be hoovering up disaffected government supporters (and there are two government parties from which to scoop voters up this time). But Labour are struggling to stay above water and their leader, and the team around him, will ultimately be held responsible for that.
One clear manifestation of this is when it comes to the current number one voter priority: the NHS. When asked which party is most trusted to manage the NHS Labour come out on top, although the seven point lead is lower than they would like. However, when the public are asked to choose between Messrs Miliband and Cameron to manage the NHS, the two are level pegging.
How much of the leadership issue has already been priced into Labour’s vote share remains to be seen, but the final 98 days will be all about trust and credibility, and motivating a distinctly underwhelmed electorate.

HOLYROOD SWAGGER
While the “Better Together” campaign may have succeeded in holding off Scottish independence for now, the issue of devolved powers is by no means settled. When the three leaders of the Westminster parties rushed up to Scotland to pledge greater powers to Scotland as part of “The Vow” they cannot have known what they had opened the gates to.
An exclusive ComRes poll of MSPs reveals that a majority in Holyrood support devolving power on every policy area from Westminster to the Scottish Parliament, from foreign policy and defence to abortion and medicines. However, income tax is the number one issue MSPs want devolving north of the border with 82% supporting this change.
Scotland will receive perhaps more focus than usual at this General Election because of the SNP’s post-referendum surge and Labour’s heavy reliance on the 41 Westminster seats they currently hold in Scotland.
Not only do these findings ask questions of the current system and where powers might be devolved, but inevitably it leads to questions over what impact any further devolution will have on England, Wales and Northern Ireland. 
Follow ComRes on Twitter for the latest polls and analysis:
@ComResPolls
Author:
Tom Mludzinski
Head of Political Polling

@tom_ComRes 
Be prepared for GE2015 with the new ComRes Election Toolkit: 
Battlebus

The 2015 Battlebus is an online survey of 1,000 adults living in the 40 most marginal constituencies where Labour and the Conservatives share first and second place between them and battle head-to-head to get their candidate elected. This survey offers unique access to the opinions of those voters who will win or lose the election for the main parties - all at omnibus price levels.
In the run up to the election, and whilst the parties are drafting their manifestos, this research tool is ideal for ensuring that each of the parties know the importance of your policy issues to those who will be decisive in getting them elected. This can be very powerful for lobbying material or for generating media hits.
Future MPs survey

Based on forecasts using our long-term voting intention surveys and careful psephological analysis, we have formulated a method of gauging the most likely composition of the House of Commons after May 2015.
Guaranteeing a sample of 100 of those MPs and PPCs who are most likely to take a seat in Parliament after 2015, ComRes is offering its clients a chance to gain vital insight into the levels of support for policy issues post 2015, enabling organisations to be on the front foot for when the new Parliament sits.
More information here

YOUGOV (Voting intentions Vs Party of real ability)

https://yougov.co.uk/refer/HdvYK1txkm0PfdJX43_Iow/  <<< Follow the link if you would like to join the YOUGOV panel and have your opinions heard

http://cdn.yougov.com/cumulus_uploads/document/wcq9qvragy/YG-Archive-Pol-Sun-results-290115.pdf 

GUARDIANS #GE2015 PROJECTION

Based on the Guardian’s current average of polls, this is how the next parliament would look:

 
The polling shows there are at least 50 seats where the party currently in the lead is ahead by only the tiniest of margins (marked in a lighter shade above). The result in these contests will often depend on how well Ukip and the Greens perform.

Originally posted HERE 

Thursday 29 January 2015

ELECTION FORECASTS NOWCAST, IF THE #GE2015 WAS HELD TODAY

The votes and seats totals shown elsewhere on this site are forecasts.  They are predictions about what will happen on 7 May 2015.  These forecasts are based on where we think the polls are today, combined with historical evidence about how support for parties evolves as elections approach.  As such, they will have significant uncertainty until just before the election.  Because they are predictions about what will happen on 7 May, there is no way to evaluate them until the election occurs.
This tab provides our estimates of what constituency polls conducted today in every constituency would find.  This is not exactly an estimate of what would happen in an election today, and it may not exactly match the current national polls.  Since Lord Ashcroft Polls is currently publishing the vast majority of constituency polls, these Nowcasts specifically aim to predict where those polls would find each constituency in the question “Thinking specifically about your own Parliamentary constituency at the next General Election and the candidates who are likely to stand for election to Westminster there, which party's candidate do you think you will vote for in your own constituency?” 
This Nowcast allows us to evaluate the performance of our model at interpolating the likely situation in unpolled constituencies every time Lord Ashcroft releases polls of previously unpolled constituencies.  While there are many other aspects of our forecasting model, one important component is to correctly determine what is likely to be happening right now in unpolled constituencies, or in constuencies that have not been polled in many months, and so the degree to which we are successful at that is important.  Every time there are new constituency polls released, we will write a blog post evaluating how well our Nowcasts predicted those constituency polls at the LSE General Election blog.
Here are our estimates of what these hypothetical constituency polls would look like in every GB seat:
Sortable table of current vote share for every party in every seat.
Sortable table of current probability of victory for every party in every seat.
If we aggregate the vote shares to the regional level, we get these totals:
  Con Lab LD SNP PC GRN UKIP Oth
East Midlands 32 35 7 0 0 6 19 1
East of England 37 22 11 0 0 8 22 1
London 29 43 10 0 0 7 10 1
North East 20 49 7 0 0 6 18 1
North West 24 45 9 0 0 5 16 1
Scotland 12 31 7 43 0 4 2 1
South East 41 19 12 0 0 7 18 2
South West 36 19 17 0 0 9 18 1
Wales 19 40 8 0 12 4 16 1
West Midlands 31 35 7 0 0 6 20 2
Yorkshire and The Humber 23 41 8 0 0 6 20 1
If these seat predictions and vote predictions were aggregated up to the GB level, we get these totals:
Party Lo Seats Hi Swing Lo Votes Hi Swing
Conservatives 248 254 262 -52 29.4% 29.8% 30.2% -7.1%
Labour 294 302 311 44 31.8% 32.3% 32.7% 2.6%
Liberal Democrats 19 22 25 -35 9.5% 9.8% 10.1% -13.7%
SNP 35 41 46 35 3.5% 3.6% 3.8% 1.9%
Plaid Cymru 1 2 3 -1 0.5% 0.6% 0.6% -0.0%
Greens 1 2 3 1 6.2% 6.5% 6.8% 5.6%
UKIP 5 8 10 8 15.8% 16.1% 16.5% 13.0%
Other 1 1 1 0 1.2% 1.3% 1.4% -2.3%

50 FOR 15 (TAKING A LOOK AT 50 MARGINAL SEATS)

About 50 for 15

As a British voter, chances are that you don’t live in a marginal constituency. How you vote in May 2015, then, is likely to be pretty much irrelevant. What’s important are the opinions of voters in marginal constituencies.
Beginning with this premise, 50for15 aims to provide independent and rigorous journalism about 50 marginal constituencies, chosen to include as many of the different themes of the general election as possible, that will define the make-up of Britain’s next government.
We strive to look beyond the scandals that will cover the pages of the mainstream media, and instead focus on the local issues and people that will be just as important as much as, if not more than, the rhetoric of Cabinet and Shadow Cabinet.
We have set ourselves the challenge of visiting each and every one of these 50 seats – if you’re involved in politics in one of those constituencies, we’d love you to get in touch.
You might want to take a look at our first article, which explains a bit more about the project. Otherwise, just poke around. And let us know what you think.


50for15’s constituency profiles

The Psephological Society #GE2015 Projection

Latest Vote UK "projection":

Lab 281
Con 277
LD 33
SNP 31
UKIP 5
PC 3
Green 1
Spkr 1
NI 18

Gains/losses:

32 Lab gains from Con
10 Lab gains from LD
8 Con gains from LD
19 SNP gains from Lab
6 SNP gains from LD
5 UKIP gains from Con
1 DUP gain from Alliance

VOTE MATCH NEEDS YOUR HELP

Watch the video and follow the link if you would like to find out more about vote match

https://www.crowdshed.com/projects/vote-match-the-online-voter-quiz

YOUGOV POLL BREAKDOWN BY AGE

https://yougov.co.uk/refer/HdvYK1txkm0PfdJX43_Iow/  <<< Follow the link if you would like to join the YOUGOV panel and have your opinions heard

http://cdn.yougov.com/cumulus_uploads/document/ujq752kmtw/YG-Archive-Pol-Sun-results-280115.pdf 

Lord Ashcroft: SNP Surge "Is Real"

Wednesday 28 January 2015

Latest #GE2015 betting

William Hill have cut their odds for David Cameron NOT to take part in a multi- Party (4 or more) tv leader debate before the General Election from 11/4 to 12/5 but still believe he is more lilkely to agree to be included.

'There is a widespread feeling that Mr Cameron would really like to find a way of avoiding taking part in the tv debates as he has the most to lose if he does so, but the humiliation of potentially being represented by an empty chair is likely to result in him ultimately taking part' said Hill's spokesman Graham Sharpe. Hills offer 3/10 that he WILL take part.

DAVID CAMERON is 4/7 favourite still to be PM on August 1, 2015 with Hills who offer 11/8 that Ed  Miliband will be in Number Ten by then.

WILLIAM HILL have cut their odds for TWO General Elections to take place during 2015 from an opening 8/1 to 9/2. 'The more likely another Hung Parliament appears, the more likely political punters think a second 2015 General Election is' said Hill's spokesman Graham Sharpe.

**With a commission set up by John Bercow recommending online voting should be permitted, William Hill are offering 3/1 that it is introduced for General Elections before the end of 2020. It is 1/ 4 not to happen by then.

**And Hills are also betting that 16/17 year olds will be getting a vote in General Elections - offering 2/5 that will happen by the end of 2024; 7/4 that it will not.

WILLIAM HILL...GENERAL ELECTION.......3/10 No overall majority; 4/1 Con-LD coalition; 9/2 Conservative majority; 9/2 Labour minority government; 11/2 Conservative minority govt; 11/2 Lab-LD coalition; 11/2 coalition involving SNP; 6/1 Labour majority; 7/1 coalition involving UKIP; 20/1 coalition involving Greens; 50/1 UKIP majority; 500/1 Lib Dem majority; 33/1 any other outcome.

'The General Election has turned into a political Grand National with a dozen possible outcomes, and an eight figure sum sure to be riding on who will be the biggest Party ,and how the make-up of the next government will turn out.This will be the biggest betting General Election ever with over £10m gambled' says William Hill spokesman, Graham Sharpe.

PARTY TO WIN MOST SEATS....5/6 Conservatives; Evens Labour.

Further information.....graham sharpe....0780 3233702

Poll Question - Should the Questions asked at PMQs be set by the public?

http://www.easypolls.net/poll.html?p=54c8da1ae4b085691df79c7e <<< link to poll


Today we had what seemed to epitomises the problems that the general public see in politics

400 people just shouting down each other. Todays PMQs turned into Milibands last question not even being a question but a statement and the Prime Minister answering the questions asked of him, with a question of the opposition.

So would a system where the constituents gave a question to their MP and then that MP must ask the question of the PM?

Doubt it would happen as they want the planted question and this knock about politics is all for point scoring but we have to reengage the public into politics. These people influence our lives and we are paying for them to do it.

Candidates selected to replace retiring MPs #GE2015

Andy has done a great job collating information see his full spreadsheet here


Candidates selected to replace retiring/deselected MPs


ConstituencyParty


Julie Pörksen — (Alan Beith)


Berwick-upon-TweedLD: 1
Karin Smyth — (Dawn Primarolo)


Bristol SouthLab: 1
Craig Williams — (Jonathan Evans)


Cardiff NorthCon: 1
Chris Philp — (Richard Ottaway)


Croydon SouthCon: 2
Vikki Slade — (Annette Brooke)


Dorset Mid & Poole NorthLD: 2
Liz Evans — (Martin Caton)


GowerLab: 2
Ranil Jayawardena — (James Arbuthnot)


Hampshire North EastCon: 3
Tulip Siddiq — (Glenda Jackson)


Hampstead & KilburnLab: 3
Lisa Smart — (Andrew Stunell)


Hazel GroveLD: 3
Vicky Foxcroft — (Joan Ruddock)


Lewisham DeptfordLab: 4
Robert Jenrick — (Patrick Mercer)


NewarkInd (Con)
Rowenna Davis — (John Denham)


Southampton ItchenLab: 5
Tom Tugendhat — (John Stanley)


Tonbridge & MallingCon: 4
Nigel Huddleston — (Peter Luff)


Worcestershire MidCon: 5
Matthew Pennycook — (Nick Raynsford)


Greenwich & WoolwichLab: 6
Nusrat Ghani — (Charles Hendry)


WealdenCon: 6
Lucy Frazer — (Jim Paice)


Cambridgeshire South EastCon: 7
David Mackintosh — (Brian Binley)


Northampton SouthCon: 8
Karen Whitefield — (Eric Joyce)


FalkirkInd (Lab)
Colleen Fletcher — (Bob Ainsworth)


Coventry North EastLab: 7
Liz Saville Roberts — (Elfyn Llwyd)


Dwyfor MeirionnyddPC: 1
Ibrahim Tahuri — (Sarah Teather)


Brent CentralLD: 4
Richard Burgon — (George Mudie)


Leeds EastLab: 8
Christine Jardine — (Malcolm Bruce)


GordonLD: 5
Tim Brett — (Menzies Campbell)


Fife North EastLD: 6
Stephen Kinnock — (Hywel Francis)


AberavonLab: 9
Richard Baker — (Frank Doran)


Aberdeen NorthLab: 10
Helen Hayes — (Tessa Jowell)


Dulwich & West NorwoodLab: 11
Kate Hollern — (Jack Straw)


BlackburnLab: 12
Ruth Smeeth — (Joan Walley)


Stoke-on-Trent NorthLab: 13
Maggie Throup — (Jessica Lee)


ErewashCon: 9
Marie Rimmer — (Shaun Woodward)


St Helens South & WhistonLab: 14
Louise Haigh — (Meg Munn)


Sheffield HeeleyLab: 15
Jo Cox — (Mike Wood)


Batley & SpenLab: 16
Steve Bradley — (Don Foster)


BathLD: 7
Melanie Ward — (Lindsay Roy)


GlenrothesLab: 17
Johanna Boyd — (Anne McGuire)


StirlingLab: 18
Justin Madders — (Andrew Miller)


Ellesmere Port & NestonLab: 19
Seema Kennedy — (Lorraine Fullbrook)


South RibbleCon: 10
Kit Malthouse — (George Young)


Hampshire North WestCon: 11
James Cartlidge — (Tim Yeo)


Suffolk SouthCon: 12
Craig Mackinlay — (Laura Sandys)


Thanet SouthCon: 13
Amanda Mlling — (Aidan Burley)


Cannock ChaseCon: 14
Kevin Hollinrake — (Anne McIntosh)


Thirsk & MaltonCon: 15
Melanie Onn — (Austin Mitchell)


Great GrimsbyLab: 20
Victoria Atkins — (Peter Tapsell)


Louth & HorncastleCon: 16
Rebecca Long-Bailey — (Hazel Blears)


Salford & EcclesLab: 21
Gerald Vernon-Jackson — (Mike Hancock)


Portsmouth SouthLD: 8
Angela Rayner — (David Heyes)


Ashton-under-LyneLab: 22
Craig Tracey — (Dan Byles)


Warwickshire NorthCon: 17
Boris Johnson — (John Randall)


Uxbridge & South RuislipCon: 18
Peter Dowd — (Joe Benton)


BootleLab: 23
Oliver Dowden — (James Clappison)


HertsmereCon: 19
Heidi Allen — (Andrew Lansley)


Cambridgeshire SouthCon: 20
Rishi Sunak — (William Hague)


Richmond (YORKS)Con: 21
Carolyn Harris — (Sian James)


Swansea EastLab: 24
Matt Warman — (Mark Simmonds)


Boston & SkegnessCon: 22
Alan Mak — (David Willetts)


HavantCon: 23
Harry Harpham — (David Blunkett)


Sheffield Brightside & HillsboroughLab: 25
Christina Rees — (Peter Hain)


NeathLab: 26
Johanna Churchill — (David Ruffley)


Bury St EdmundsCon: 24
Victoria Prentis — (Tony Baldry)


BanburyCon: 25
Judith Cummings — (Gerry Sutcliffe)


Bradford SouthLab: 27
Rachel Gilmour — (Jeremy Browne)


Taunton DeaneLD: 9
Alberto Costa — (Andrew Robathan)


Leicestershire SouthCon: 26
Keir Starmer — (Frank Dobson)


Holborn & St PancrasLab: 28
Gerald Jones — (Dai Havard)


Merthyr Tydfil & RhmneyLab: 29
Josh Mason — (Ian Swales)


RedcarLD: 10
David Rendel — (David Heath)


Somerton & FromeLD: 11
James Cleverly — (Brooks Newmark)


BraintreeCon: 27
Wendy Morton — (Richard Shepherd)


Aldridge-BrownhillsCon: 28
Edward Argar — (Stephen Dorrell)


CharnwoodCon: 29