This page gives details of
the current forecast from a new polls-based method for forecasting a general election
on 7th May 2015. The method was revised in February 2014 and is described in a working paper.
The original October 2013 working paper is here. There is also occasional commentary at
my Elections
etc. blog. To receive Tweets with updates of both the forecast and
commentary, follow me @StephenDFisher.
The approach is broadly to predict the next election
based on current opinion polls and the track record of polls in previous
electoral cycles, allowing for change in opinion in the run up to the election.
The method allows for three main historical tendencies: governments being more
likely to recover and oppositions fall back; parties moving back towards their
long-run average level of support and/or the level of support at the previous
election; and lastly and by far the least important tendency is for the
Conservatives to over perform and Labour to under perform their vote intention
figures in the polls when it comes to election day. All three suggest a Conservative
recovery and a Labour set back from autumn 2013. The statistical regression
methodology generates estimates of uncertainty and so prediction intervals
(range of likely outcomes) and probabilities for key events are also provided
below. The forecast represents a way to think about the
implications of current opinion polls for the outcome of the next general
election in light of the historical relationship between polls and election
results. It is the product of a statistical analysis of the data and not my
personal opinion about what will happen.
Date of forecast: 27.06.2014
Days till the election: 314
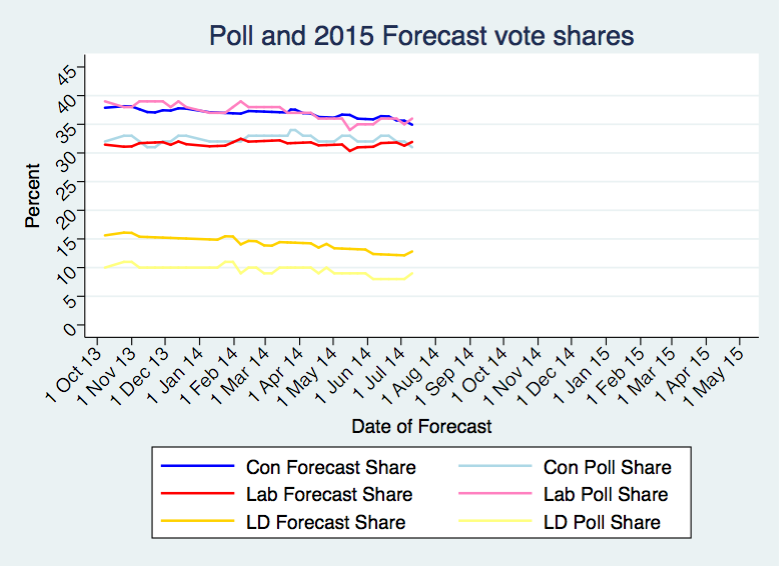
Inputted current average poll shares
Con : 32 -1
Lab : 36
LD : 8
Oth : 24 +1
UKIP: 15 +1 so UKIP share of combined Others vote is 63%
Forecast Election Day Shares with 95% Prediction Intervals
Con : 35.7 plus or minus 7.8 i.e. between 28 and 43
Lab : 31.8 plus or minus 5.8 i.e. between 26 and 38
LD : 12.2 plus or minus 8.9 i.e. between 3 and 21
Implied point estimate shares for:
Others combined: 20.3
UKIP :
12.7 (based on share of combined Others vote.)
Forecast Election Day Seats (changes from last week)
Con : 302 (-5)
Lab : 292 (+4)
LD : 28 (+1)
Con largest party, but short of a
majority by 24 (+5)
Forecast Election Day Seats with approximate 95% Prediction Intervals
Assuming LD share at 12.2 and Other share at 20.3 and allowing Con and Lab to vary as per
intervals above.
Con between 219 and 398
Lab between 201 and 369
LD between 22 and 35
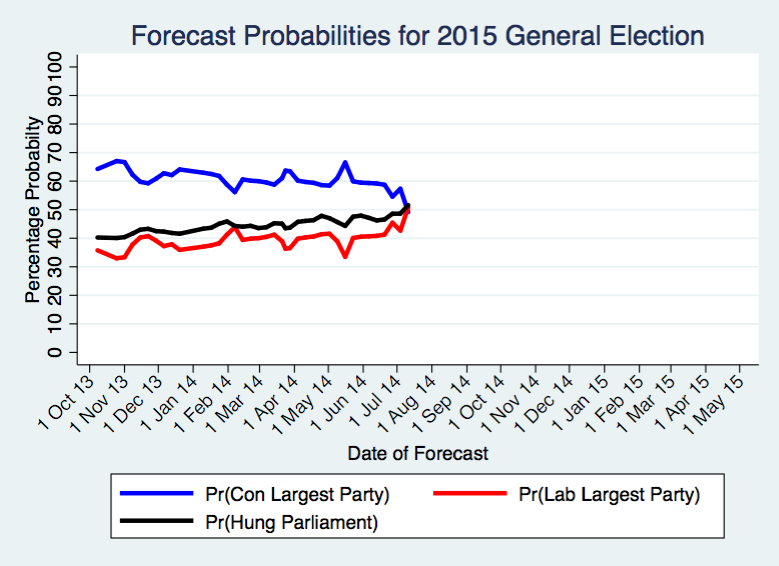
Approximate probabilities of key outcomes
Pr(Con largest
party) = 55% -4%
Pr(Lab largest
party) = 45% +4%
Pr(Con majority) =
29% -5%
Pr(Lab majority) =
22% +3%
Pr(Hung
parliament) = 49% + 2%
Pr(Hung parliament with Con largest party) = 26%
Pr(Hung parliament
with Lab largest party) = 23%
The inputted current polling average is that from UK Polling Report,
chosen because it is sensible, convenient and frequently updated. But this is
not a claim that this is necessarily the best estimate of current opinion and
it would be reasonable to use other methods of averaging recent polls. On
occasion I will adjust the polling average to make it more up to date.
I try to update the forecast every week, and mostly on
Fridays.
Acknowledgements: I am very grateful for comments to John Curtice,
Jouni Kuha, Clive Payne,
Mark Pickup and Chris Prosser, and to Rob Ford, Will Jennings and Chris Wlezien for early discussions about this work. I am also
very grateful for the numerous and wide ranging comments on Twitter and
elsewhere online in response to previous drafts. The paper has been revised
substantially in part thanks to them. Most especially, I am indebted to Will
Jennings for compiling and preparing the historical polling data. The
methodology is a combination of previously developed techniques with
refinements and new developments. Please see the working paper for full details
including citations to previous related methods.
Department of Sociology
University of Oxford
Manor Road
Oxford OX1 3UQ
stephen.fisher@
sociology.ox.ac.uk or trinity.ox.ac.uk
No, I don't get it.
ReplyDeleteLabour to fall below their long term glass floor against a the generally unpopular Tory incumbents?
Cleggy's Clowns to progress despite the public getting to see them in isolation with their silly red noses?
UKIP and Greens still in with "others" despite having 27 MEPs between them?
Last time out the LibDems got 6.8 million votes the bulk of which were protest votes, Joe Public being sick and tired of the LabCon axis of incompetence, those people are going Green or Kip depending on their predilection, these two will have an enormous impact on the final seat count imho. Obviously in the case of the Kip this will mean a load of gallant seconds to Con in the South and Lab in the North, but I believe there are more than enough concentrations of local support to get them over the line in three way fights, Ashcroft's polling in the marginals, despite the general assumption that the MoE might be a tad higher than normal, suggests to me the Tories will need an even bigger lead than your vote projection to get even close being the biggest party.
The psephology of the past will I believe need to be put back into its box next May.