Going into the formal campaign period we’ve revised the methodology for the ElectionsEtc.com general election forecast.
For the GB share of the vote forecast we are still using the same method we have been for over a year (described in this working paper). The main idea is to look at historical election results and polls and estimate how best to use opinion polls to predict future election results. Our small predicted rise in the Tory vote and corresponding 1-point drop for Labour are primarily due to this historical average pro-Labour polling bias.
Further out from the election we were also forecasting government recovery and opposition setback effects. Now we are so close to the election — and because both Labour and the Conservatives are polling not far from their 2010 vote shares — there is little historical reason to expect much swing back for either of the two main parties.
By contrast, the Liberal Democrats are predicted to recover a bit and UKIP fall back somewhat by the time of the election because their polling figures are still dramatically different from their 2010 levels.
The changes in Scotland are still more dramatic, with the polls showing around a 20-point swing from Labour to the SNP. We don’t have enough historical Scotland-only polls to apply similar models, but we have thus far used a swing-back adjustment estimated from GB models. We are now weakening that assumption, mainly because the changes in Scotland much more structural than simply part of an electoral cycle effect.
The major methodological change we have made going into the campaign is to model between constituency variation. This is done using Ashcroft constituency polls and individual-level data with constituency identifiers kindly provided by YouGov. The approach is similar to that used for modelling exit poll data, i.e. model the change since 2010 at the constituency level. This has been done for Scotland separately from England and Wales and precedence given to evidence consistent between both the Ashcroft and YouGov data.
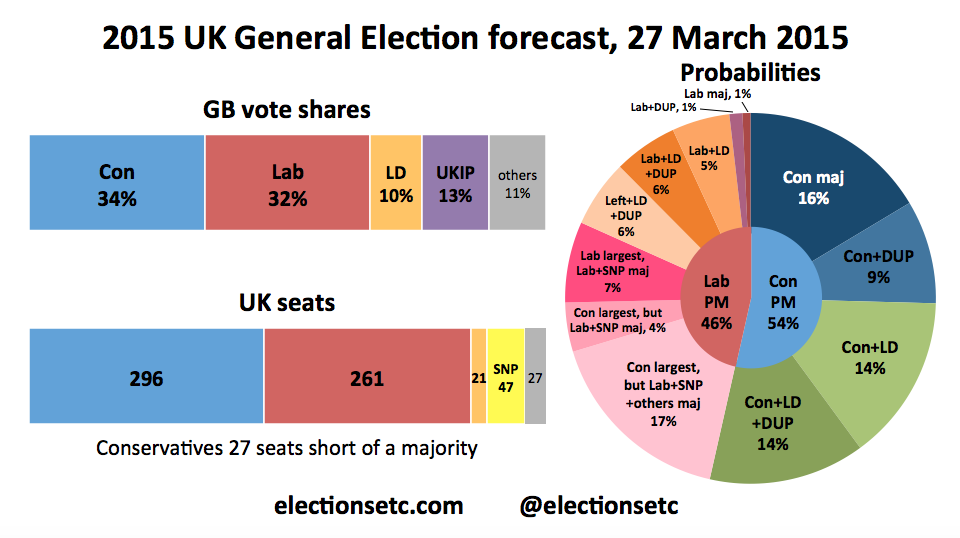
The main constituency level patterns that make a noticeable difference to our seats forecast are Scottish Labour falling further where they started stronger and first-time incumbent Conservative MPs doing better. The former helps the SNP and the latter the Tories, while both hurt the forecast number of Labour seats. The result is a 35-seat lead for the Conservatives, but still a tally that leaves them well short of a majority.
This makes the chances of a Conservative-led government much greater, with a 54% chance of David Cameron remaining as Prime Minister. But the chances that the Tories will get the most seats is greater still. At 74%, it now matches the chances that they will get the most votes. This means that if we are right about the pattern and extent of the constituency variation, there will be practically no electoral-system bias at the election.
We have changed the schema for the governing majorities pie chart to reflect the fact that the SNP have repeatedly promised that they would definitely vote against a Tory Queen’s speech to lock them out of government. The chart shows probabilities assuming Labour will try to govern without the SNP if it can get a majority with the Liberal Democrats and/or DUP and assuming that Labour and the SNP will be able to do enough of a deal for government to continue for a while if Labour does depend on the SNP.
One thing that hasn’t changed since last week is the polling average going into all this. Conservatives and Labour are still neck-and-neck on 33% which means that there hasn’t been an budget bounce.
Date of forecast: 27 March 2015
Days till the election: 41
Inputted current average poll shares
Con: 33%
Lab: 33%
LD: 8%
UKIP: 14%
Others: 12%
Forecast GB Vote Shares (with 95% Prediction Intervals)
Con: 34% (30% – 38%)
Lab: 32% (27% – 36%)
LD: 10% (6% – 14%)
UKIP: 13% (9% – 17%)
Others: 11% (9% – 13%)
Forecast Scotland Vote Shares (with 95% Prediction Intervals)
SNP: 45% (41% – 49%)
Labour: 28% (24% – 32%)
Forecast GB Seats (with 95% Prediction Intervals)
Con: 296 (251– 343)
Lab: 261 (217 – 303)
LD: 21 (11 – 31)
SNP: 47 (36 – 55)
PC: 3 (2 – 3)
UKIP: 5 (4 – 5)
Grn: 1
(May not sum to 632 due to rounding of sums of probabilities.)
Central forecast: Con short of a majority by 27
(Criterion for majority now changed to 323 not 326, assuming Sinn Fein win 5 seats and do not take them.)
Probabilities of key outcomes
Con most votes: 74%
Lab most votes: 26%
Con most seats: 74%
Lab most seats: 26%
Hung Parliament: 83%
… with Con largest: 58%
… with Lab largest: 25%
Probabilities of predicted government outcomes:
(See here for explanations and assumptions)
Con majority: 16%
Con+DUP: 9%
Con+LD: 14%
Con+LD+DUP: 14%
Con largest, but Lab+SNP+others maj: 17%
Con largest, but Lab+SNP maj: 4%
Lab largest, Lab+SNP maj: 7%
Lab+LD+DUP+SDLP+PC+Grn+Hermon: 6%
Lab+LD+DUP: 6%
Lab+LD: 5%
Lab+DUP: 1%
Lab majority: 1%
(Probabilities may not sum due to rounding)
No comments:
Post a Comment
Comment is open to all feel free to link to this blog.