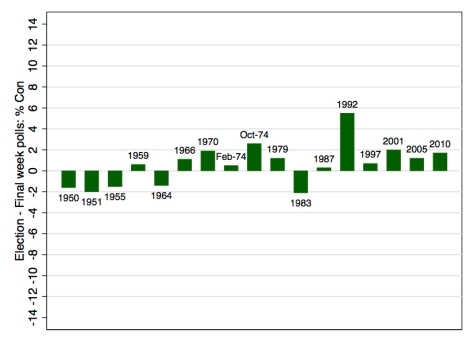
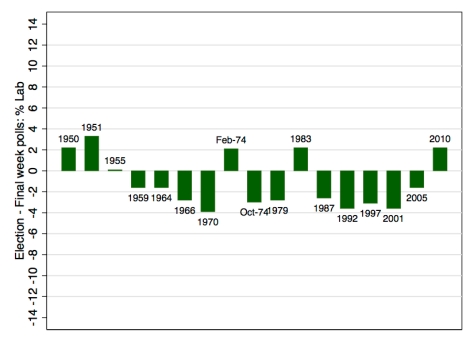
The graphs below looks at the average of the polls between 85 and 115 days out in each election cycle since 1950 and how these compared with the eventual outcome for both the governing and principal opposition parties.


The opposition setback effect has been reasonably consistent since 1970, but the government recovery from this point in the cycle has not been so reliable in more recent elections. A large part of the average government recovery from c.100 days out is driven by the elections in the 1950s.
This wasn’t always the case. Equivalent graphs (eg. for 8 months out) show much more consistent government recoveries. It just happens that, over the last year or so, the Conservatives haven’t made the recovery history suggests they ought to have.
The Tories might take some comfort from the 1987 and 1992 recoveries from 100 days out in the first graph. But the further graphs below, comparing election results to final week polls, shows that in 1992 the polling industry bias or late swing to the Tories was even greater than the measured recovery from 100 days out. In fact, the Tories actually went down in the polls over the last 100 days in 1992, but were saved by the discrepancy between the final polls and the actual election outcome.


The graphs for election results relative to final week polls – plus the experience of polls for the European Parliament elections last year – suggest that the polls may be generous to Labour and underestimating the Tories again this year. But it would be unwise to rely on it.
Date of forecast: 30 January 2015
Days till the election: 97
Inputted current average poll shares
Con: 32%
Lab: 33%
LD: 8%
UKIP: 15%
Others: 12%
Forecast GB Vote Shares (with 95% Prediction Intervals)
Con: 33.9% (±5, i.e. 29% – 38%)
Lab: 31.3% (±5, i.e. 27% – 36%)
LD: 10.4% (±5, i.e. 6% – 15%)
UKIP: 13.6% (±5, i.e. 9% – 18%)
Others: 10.8% (±2, i.e. 9% – 13%)
Forecast Scotland Vote Shares (with 95% Prediction Intervals)
SNP: 43% (±5, i.e. 38% – 48%)
Labour: 30% (±5, i.e. 25% – 35%)
Forecast GB Seats (with 95% Prediction Intervals)
Con: 282 (234 – 336)
Lab: 280 (228 – 325)
LD: 24 (13 – 38)
SNP: 40 (26 – 50)
PC: 3
UKIP: 3
Grn: 1
(May not sum to 632 due to rounding of sums of probabilities. Prediction intervals not yet available for UKIP, PC and Grn.)
Central forecast: Con largest party, but short of a majority by 41
(Criterion for majority now changed to 323 not 326, assuming Sinn Fein win 5 seats and do not take them.)
Probabilities of key outcomes
Con largest: 51%
Lab largest: 49%
Hung Parliament: 84%
… with Con largest: 41%
… with Lab largest: 43%
Probabilities of predicted government outcomes:
(See here for explanations and assumptions)
Con majority: 10%
Con+NDown: 1%
Con+ND+DUP: 6%
Con+ND+LD: 9%
… with Con+ND+DUP also possible: 6%
… without Con+ND+DUP also possible: 3%
Con+ND+DUP+UKIP: 0%
Lab majority: 6%
Left (Lab+SDLP+PC+Grn): 4%
Left+LD: 26%
… with LD as kingmakers: 1%
… without LD as kingmakers: 25%
Left+SNP: 44%
… with Left+LD also possible: 25%
… without Left+LD possible: 19%
Left+SNP+LD: 25%
… with LD as kingmakers: 24%
… without LD as kingmakers: 1%
LD kingmakers: 24.5%
With a choice between Con+ND+DUP(+UKIP)+LD or
…Lab+SDLP+PC+Grn+LD: 0.5%
…Lab+SDLP+PC+Grn+SNP+LD: 24%
(Probabilities may not sum due to rounding)

It makes for interesting reading thank you. The only thing is: I'm not sure this election is like any other since 1950. Up until the last GE we had a two party system plus the Libdems. If you take by election results into account since 2010 the UKIP factor is going to make for some surprising vote splits leading to unpredictable results in many seats.
ReplyDelete